Introduction
This project is dedicated towards the design and fabrication of a system which is capable of monitoring various points of data useful for understanding and operating a photovoltaic system. Currently, maintenance of photovoltaic arrays is limited and the only way to know when a system is operating under the intended threshold is to monitor its power output. However, this metric alone is an unreliable means to judge the overall health of a photovoltaic module due to various uncorrelated factors such as cloud coverage or concurrent weather. To mitigate this issue, we aim to provide an economical system which would utilize sensors to acquire various parameters including light intensity, voltage, current, and temperature then display this information on an LCD interface.
Such a system would be capable of detecting sources of inefficiency, such as a build of dust on the PV surface, which contributes to suboptimal power output. When the system detects an issue, the owner could be alerted to the problem via the LCD interface controller and make any necessary corrections. In this way, we would enable the maximum and consistent performance of a PV array, contributing to a great output and prolonged lifespan.
In particular, we seek to distribute these systems in self-contained kits consisting of the system which the owner of a PV array could install independently with menial barrier-to-entry. The package would include a device containing the sensors, to be installed on a PV module, and the LCD display which would be placed in an area where the owner can interact with it. By the end of this research project, we expect to have designed and fabricated a prototype of such a system so that we may then enter a stage of long-term empirical testing and further refining.
Project hardware undertaken by Colton Jiorle and Project Software by Abdelghany Abouelnagga under the supervision of Dr. Amal Kabalan.
Featured Document
-
-
This guide will cover all physical components relating to the PV monitoring project. After the system is fully set up, please refer to the software guide for operable use.
-
Our device aims to analyze the health of a given photovoltaic module through the use of electrical and environmental sensors. After collecting data from each sensor, our end goal is to use this information to derive information about the panel and identify if an error has occurred and then subsequently inform the panel owner.
-
The scope of the project in our timeline included four sensors:
-
Light
-
Temperature
-
PV Voltage
-
PV Current
-
-
-
All literature I used throughout the course the project are listed in my google drive under literature.
-
Some papers delve further into the analysis of data from the sensors, however, none attempt as wide of a range and diversity of information as we do.
-
While this list is not all encompassing, it is a good start to seeing what previous work has been done in this area.
-
-
-
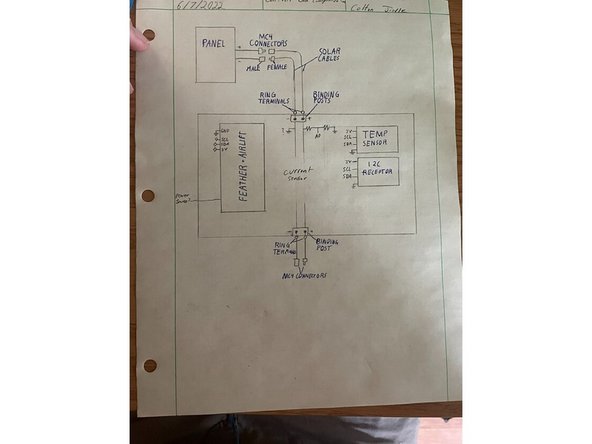
Our system is designed to be integrated between the output of a solar panel and the load for which the panel was intended, as such, the device should be intersected in line between these two items
-
When inserted, the device will receive and analyze various environmental and electrical data points and run an algorithm to determine if intervention is needed
-
From here, the system will then transmit the information obtained from where the sensors and main microcontroller are located to another device located within the owner's home and display relevant information onto an LCD screen for communication
-
-
-
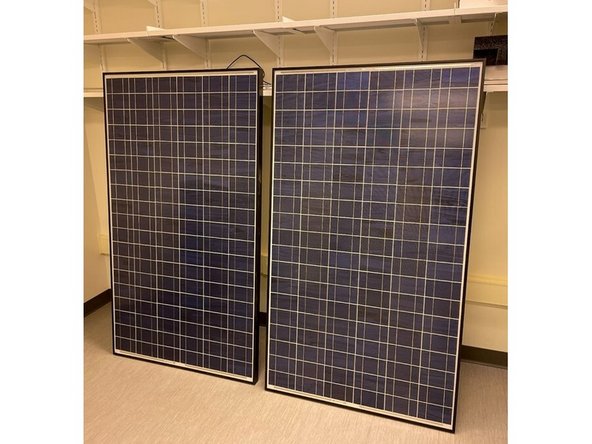
Throughout the course of this project, we have been sizing and designing all components to operate with the Evergreen Solar ES-A-200 model solar panel
-
Assume maximum voltage output is 22 V
-
Assume maximum current draw is 12 A
-
Voltage and Current meters may need to be adjusted if using panels of different specifications, however, current meters capable of such demands are available and voltage divider can be adjusted.
-
N.B. Higher currents will not harm the current meter but be clipped at the highest value. However, voltages which exceed expected values will damage the microcontroller
-
-
-
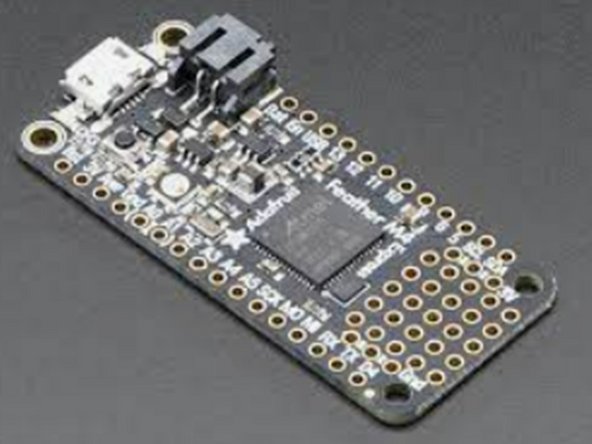
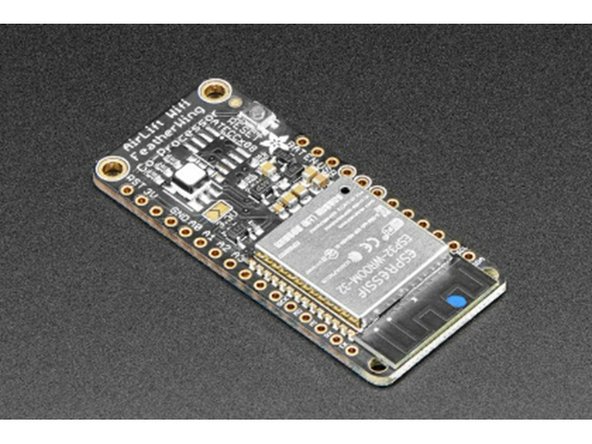
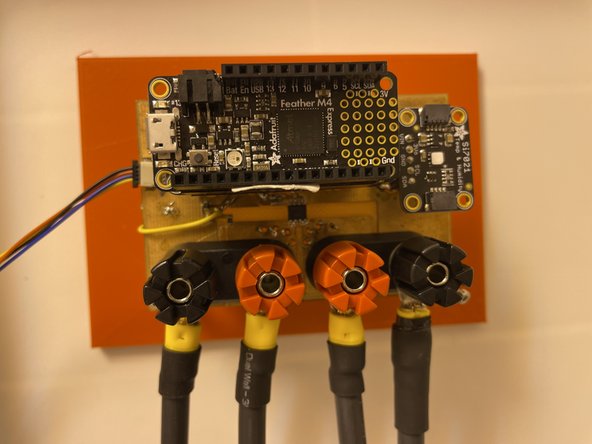
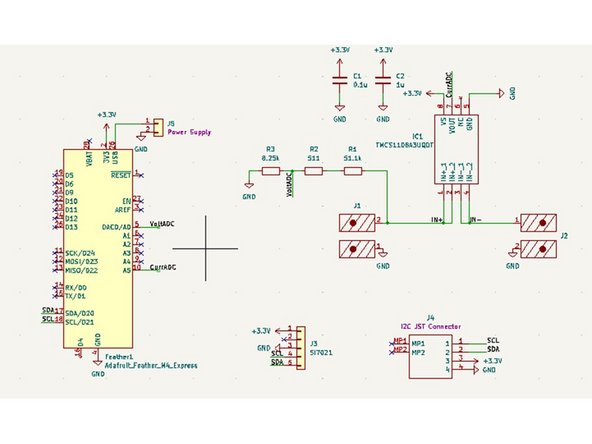
For this project, we have elected to use the Feather M4 Express paired with the Airlift Featherwing as our microcontroller
-
Two of these feathers + wings are used, 1 on the panel collecting data, and the other receiving data and displaying it on the LCD screen
-
-
-
The means for how each metric is obtained is listed below
-
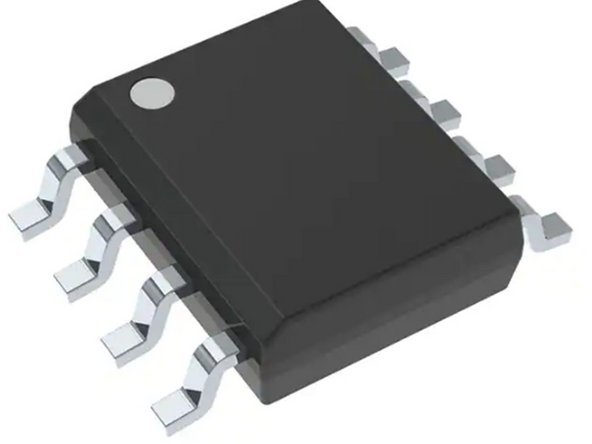
Current Meter: TMCS1108A3U-Q1
-
Voltmeter: Voltage Divider (R1 = ~51.45 kOhm, R2 = 8.2 kOhm)
-
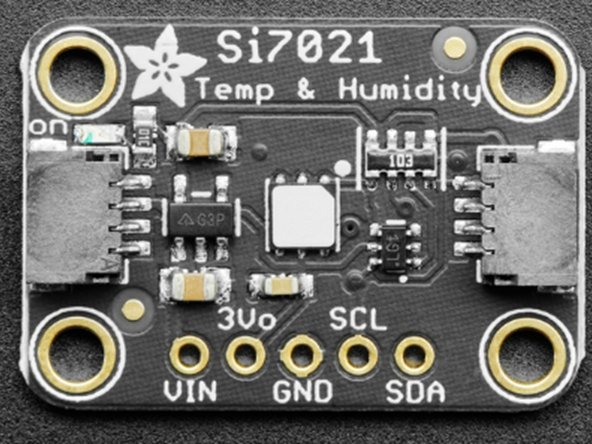
Temp & Humidity Sensor: Si7021
-
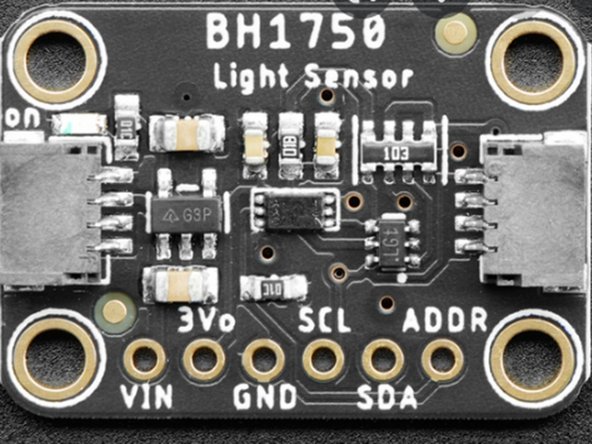
Light Sensor: BH1750
-
-
-
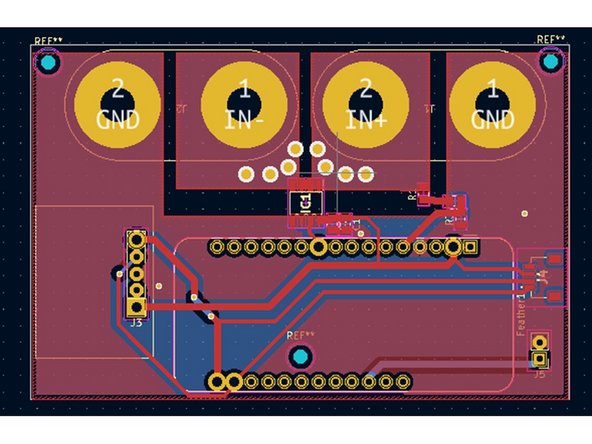
The control box is the main component of the system's hardware and represents where all information is collected and pushed to the cloud. This piece of hardware is given a central location in the system.
-
The most up to date files for the PCB can be found here.
-
N.B. There are current errors in the PCB:
-
JST Terminal pinout is backwards
-
The left side front ground plane is not connected to the rest of ground
-
Pin A0 needs to be changes to a larger via to accommodate a rivet (If milling in maker-E)
-
-
-
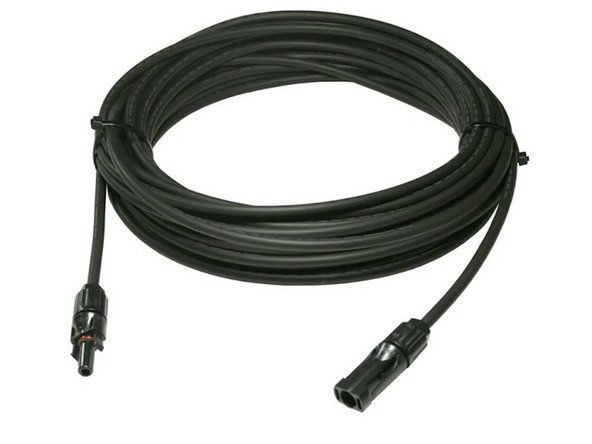
The panel we selected uses 10 AG PV cables. As such, we determined to use the same type and width cable for our connections.
-
Two male, and two female cables ends are needed such that the IN- of our device will have an identical set of M-F connectors as coming off of the panel.
-
-
-
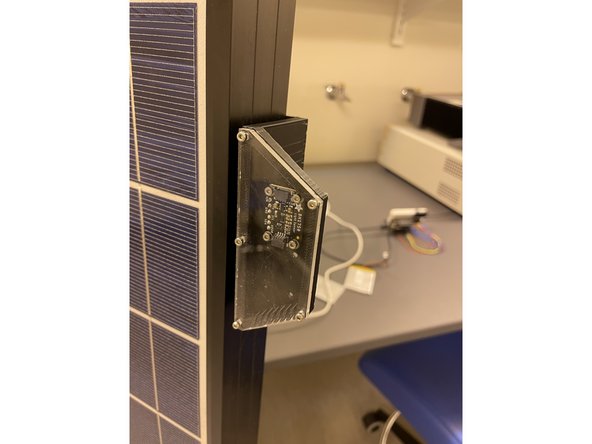
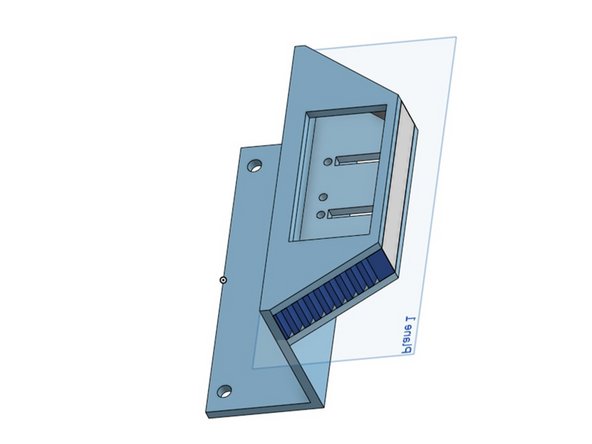
In order our system to log a representative amount of light, the light sensor is to be placed on the front face of the panel.
-
A mounting for the sensor to fix it in place was made and can be found here.
-
The design for this mounting was made in the open-source cad software OnShape
-
Note that this current model was sized for having two breakout boards inside it and will need to be adjusted for future iterations.
-
-
-
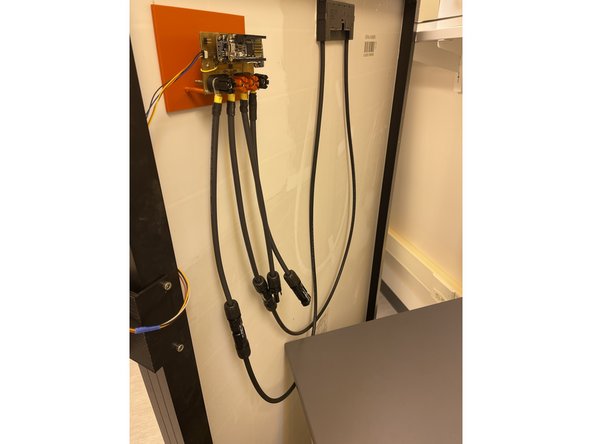
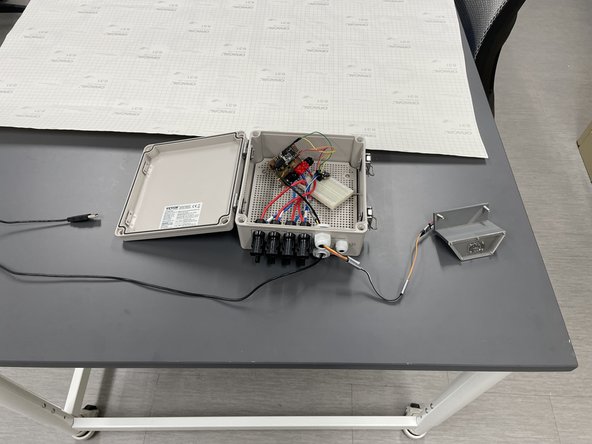
To allow for waterproofing, the PCB components of the project have been placed into a PV junction box
-
The Solar input and output cables plug into the junction box from connectors on the outside
-
The light sensor connects to the outside through a small hole for wires
-
-
-
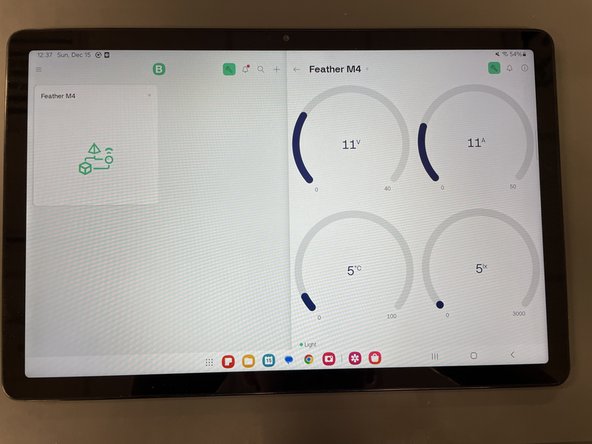
One of the main components of the project is delivering the information obtained by the system to the end user
-
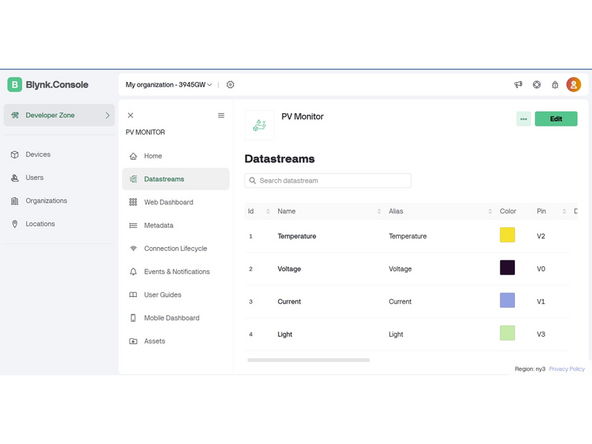
The data for voltage, current, temperature, light, and power can be accessed via the Blynk app on any smartphone or tablet
-
In order to interface with the system, we use a mobile app called Blynk to display our information
-
The microcontroller uses a push api to send data collected from the sensors to send to Blynk via Wi-fi. From there, Blynk updates their servers with this information to be accessed remotely
-
Blynk can be controlled and configured through a website portal
-